Measuring media coverage dynamics with MongoDB and Python
22 Jul 2017In a recent post, I outlined a process that aims to capture the dynamics of the media landscape by taking a snapshot of news headlines every 15 minutes. The database has been quietly growing for about a month now, receiving data scraped from 19 media organizations’ RSS feeds while the world goes about its business. Even though we only have a sliver of headlines history to work with (about 30 days), we’re ready for some analysis.
Let’s start by taking a look at an example document in the MongoDB database representing a snapshot of USA Today’s RSS feed on June 12, 2017:
{
  "_id": ObjectId("593e13134a5ac4327d88619c"),
  "datetime": datetime.datetime(2017, 6, 12, 4, 5, 32, 832000),
  "source": u"usa_today",
  "stories": [
    "'Dear Evan Hansen' wins six Tony Awards, including best musical",
    "Penguins have become NHL's newest dynasty",
    "First lady Melania Trump, son Barron officially move into the White House",
    "E3 2017: The 5 biggest reveals during the Xbox event",
    "Penguins repeat as Stanley Cup champions",
    "Homophobic slur aimed at U.S. goalkeeper Brad Guzan by Mexican fans at World Cup qualifier",
    "Ben Platt's reaction is the best GIF of the Tonys Awards",
    "Puerto Ricans parade in New York, back statehood",
    "Delta ends theater company sponsorship over Trump look-alike killing scene",
    "U.S. earns rare tie vs. Mexico in World Cup qualifier at Estadio Azteca"
  ]
}
Within the document, we see a list of stories (i.e. news headlines) alongside the source (USA Today) and the datetime when the headlines were observed. As noted above, these snapshots are created every 15 minutes with data from the RSS feeds of 19 media organizations (see the list of feeds here). At the time of writing, there are 29,925 of these snapshots in the database with headlines starting on June 12, 2017 (note: I lost all data between June 13 and July 5).
Querying Headlines with PyMongo and Pandas
In order to interact with the data, we construct a function, query_rss_stories() that wraps up the process of connecting to MongoDB, querying using the aggregation framework and regex, and organizing the results in a Pandas dataframe:
def query_rss_stories(regex):

    #connect to db
    client = MongoClient()
    news = client.news
    headlines = news.headlines

    #query the database, create dataframe
    pipeline = [
        {"$unwind":"$stories"},
        {"$match":{"stories":{'$regex':regex}}},
        {"$project":{"_id":0, "datetime":1, "stories":1, "source":1}}
    ]

    #unpack the cursor into a Dataframe
    cursor = headlines.aggregate(pipeline)
    df = pd.DataFrame([i for i in cursor])

    #round the rss query datetimes to 15mins
    df.datetime = df.datetime.dt.round('15min')
    raw_stories = df.set_index(['datetime'])

    return raw_stories
As an example, we’ll search for stories related to China:
stories = query_rss_stories('China')
stories.sample(n=5)
| source | stories | |
|---|---|---|
| datetime | ||
| 2017-07-20 14:00:00 | breitbart | Report: U.S. Bans Prompt American Allies to Bu... |
| 2017-07-14 05:45:00 | upi | India rejects China's offer to mediate Kashmir... |
| 2017-07-13 00:15:00 | wsj_opinion | How to Squeeze China |
| 2017-07-07 19:00:00 | abc | US bombers fly over East and South China Seas |
| 2017-07-12 19:15:00 | reuters | China dissident Liu's condition critical, brea... |
The stories dataframe contains all headlines related to China from all of the new sources starting around July 6. For every hour that a headline is live on a particular RSS feed, four entries will be found in the stories dataframe (since the snapshots are taken at 15-minute intervals).
Next, we unstack the data and count the number of China-related headlines found at each time step:
def create_rss_timeseries(df, freq='1h'):
    #unstack sources and create headline_count time series
    ts = df.assign(headline_count = 1)
    ts = ts.groupby(['datetime', 'source']).sum()
    ts = ts.unstack(level=-1)
    ts.columns = ts.columns.get_level_values(1)

    #set time step
    ts = ts.assign(datetime = ts.index)
    ts = ts.groupby(pd.Grouper(key='datetime', freq=freq)).mean()

    return ts

#daily time series of China headline counts
ts = create_rss_timeseries(stories, freq='1d')
To visualize, we create a stacked bar chart of China-related headline counts across all media organizations:
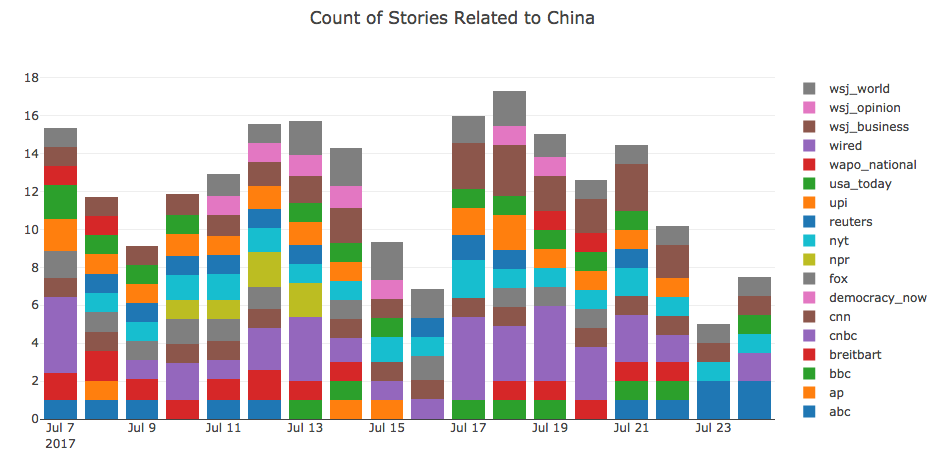 Here, we can see that each day between July 7 and July 23, 2017, between 7 and 17 China-related headlines were found from 18 media sources. Sort of interesting, but what about a more volatile topic?
Let’s take a look at the volume of headlines related to “Trump Jr”. We’ll also increase the resolution thats visualized so we can see how the media coverage evolves each hour:
jr_stories = query_rss_stories('Trump Jr')
jr_ts = create_rss_timeseries(jr_stories, freq='1h')
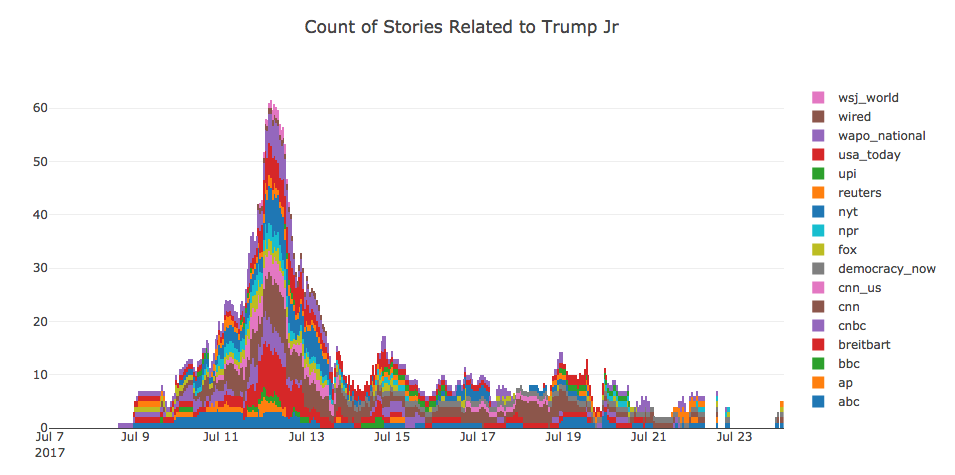 Now we’re seeing a major event play out.
Interpretations and Future Work
Recording periodic snapshots allows us to observe how the media’s interest in a particular topic changes over time. For example, a topic that’s discussed simultaneously in multiple articles by many media organizations must be especially important at a given point in time. Similarly, an issue that is featured throughout the RSS feeds for many days are likely more significant than stories that come and go within a few hours. One can think of these dynamics like the intensity and duration of rainfall events: is there are drizzle or a deluge of articles, and for how long are the stories pattering down?
I’ve only scratched the surface, but there is a lot more I’d like to investigate now that I have a handle on the data. Future Work:
- measure the proportion of attention given to particular topics
- quantify the differences in reporting between media organizations
- compare media attention to objectively important and quantifiable topics:
- casualties of war
- bombings, shootings
- environmental disasters
- natural language analysis
- differences in sentiment on particular topics
- differences in sentiment between sources
- identify any patterns between left- and right-leaning sources
- host data on public server and/or data.world